User Manual
Getting Started with Citizen Portal
Uttarakhand Stamps and Registration Department – Citizen Portal is one of the steps taken by UKSR to achieve the goal of the smart city mission. The Citizen portal is designed to provide location-based services and information to the citizens of Uttarakhand and empower them with open public data and information. The citizen portal provides various tools to easily discover and search for location-based information, it also enables users to view multiple data layers on a map and perform various data analysis like Search, Query and Around Me. The details of each tool are described in the following sections.
Note: All the functionalities of the application are available on the menu bar at the top of the application. While the map tools such as navigation tools to explore the map and basic GIS tools to explore the data on the map are available on the left side of the screen.
Navigation Tools
The following tools are used for map navigation and exploration within the active map frame.
Zoom in & Zoom out
![]()
![]() Zoom in & Zoom out - Changes the scale and centers the zoomed area.
Zoom in & Zoom out - Changes the scale and centers the zoomed area.
Zoom In – Zoom In to a map by using the Zoom In tool, which is located on the
map or by
using the keyboard shortcut +. User can use the mouse wheel to zoom in at a fixed amount or can
click on
![]() button given on
the map to zoom in or by double-click on the map to zoom in to a specific location.
button given on
the map to zoom in or by double-click on the map to zoom in to a specific location.
Zoom Out – Zoom Out to a map by using the Zoom Out tool, which is located on
the map or
by using the keyboard shortcut -. User can double-click on the map with the Zoom Out tool to
zoom out
from a specific location.
User can use the mouse wheel to zoom out at a fixed amount or can click on ![]() button given on
the map to zoom and out of the map.
button given on
the map to zoom and out of the map.
Default Extent
Default map view is the extent and scale at which the map is displayed when user first open
it. Click on
Default Map View icon ![]() will zoom in or zoom out to the default map extent (or landing scale). This will be helpful
in
situations when user zoom in or zoom out too much and not able to view map layers.
will zoom in or zoom out to the default map extent (or landing scale). This will be helpful
in
situations when user zoom in or zoom out too much and not able to view map layers.

My Location
On clicking My location icon ![]() map will zoom in to the current location of user.
The icon changes to
map will zoom in to the current location of user.
The icon changes to ![]() .Current Location of the user is highlighted.
.Current Location of the user is highlighted.
Full Screen
On clicking Full Screen icon ![]() the map will shift to full screen mode.
The icon changes to this
the map will shift to full screen mode.
The icon changes to this ![]() .
To return to default screen size user can use this option.
.
To return to default screen size user can use this option.
Extent
![]()
![]() Next Extent & Previous Extent - Switches between the extent of the page.
Next Extent & Previous Extent - Switches between the extent of the page.
Next Extent –
Allows user to go forward to the next extent. Like the forward buttons on an
internet browser, these tools step forward through the trail of recently used
map extents. Hover the mouse, system displays the Next Extent tool tip. Click
the Next View button ![]() on the toolbar, to view next extent
on the toolbar, to view next extent
Previous Extent –
Allows user to go back to the previous extent. Like the backward buttons on an
internet browser, these tools step backward through the trail of recently used
map extents. Hover the mouse, system displays the Previous View tool tip. Click
the Previous View button ![]() on the toolbar, to view previous extent. On clicking
the Previous View map returns to smaller scale.
on the toolbar, to view previous extent. On clicking
the Previous View map returns to smaller scale.
Note: At full extent Previous View button is disabled.
Search
Add text in search icon ![]() and user will get list of places like the
searched
text and on selection from list, map will be navigated to the searched
location on the map.
and user will get list of places like the
searched
text and on selection from list, map will be navigated to the searched
location on the map.
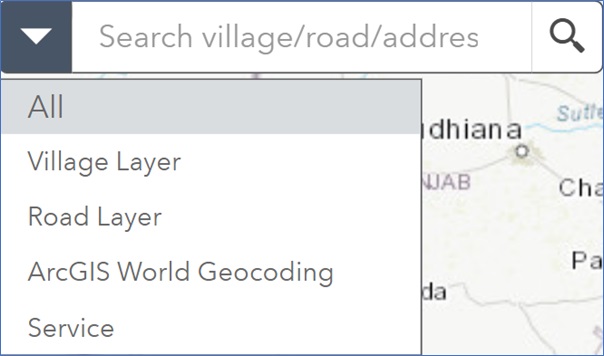
The dropdown provides three categories to search such as search by road name, search by village name and search by any address or place name using ArcGIS world geo coding service. User can search the location based on any of these categories.
GIS Tools
GIS application consists of tools to explore the map and area of interest. These tools are one of the primary ways to interact with geographic information displayed in the portal.The following GIS tools are designed for the application to explore the data layers on the map, perform various data analysis and get the location specific information. It includes tools like Base map Gallery, Layer List, Query, Around me, Search Circle Rate by POI and Directions, etc.,
Basemap Gallery
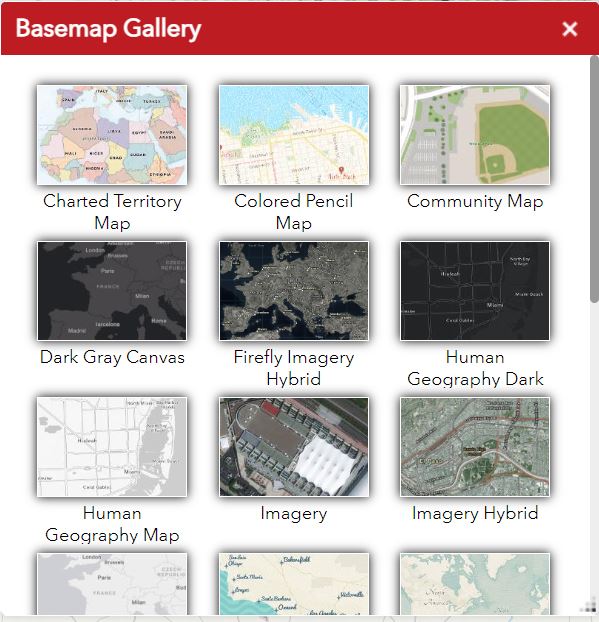
The Basemap Gallery tool ![]() presents a gallery of basemaps and allows user to select one from the gallery
as the basemap for the application.
presents a gallery of basemaps and allows user to select one from the gallery
as the basemap for the application.
- Click Basemap Gallery icon from the application.
- Choose any one of the basemap from the available basemaps in the gallery. The selected basemap will be added to the application.
Layer List
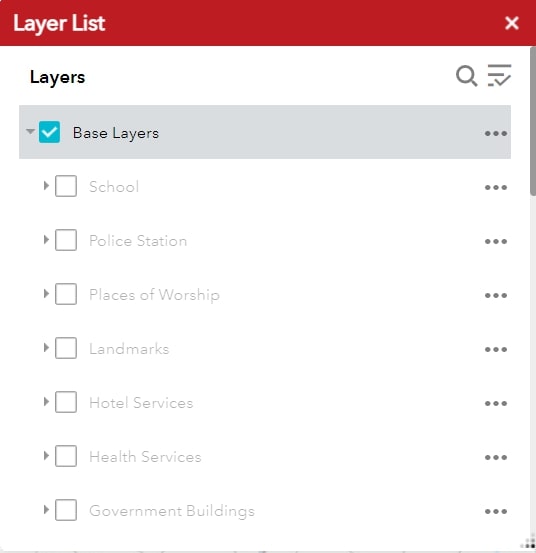
The Layer list tool provides a list of operational layers in the map display and their symbols along with the option that allows user to turn on or off the individual layers. Each layer in this list has a check box that allows user to control its visibility.
- Click Layer list
 icon from
the application.
icon from
the application. - The user can view the list of layers available in the map. User can turn them on and off by selecting the checkbox available against each layer.
- Each layer has different visibility based on the scale of the map.
- Click search option available in left side to search any layer
- Click feature action available in left corner and explore the options available such as Turn all layers on, Turn all layers off, Expand all layers and Collapse all layers.
Legend
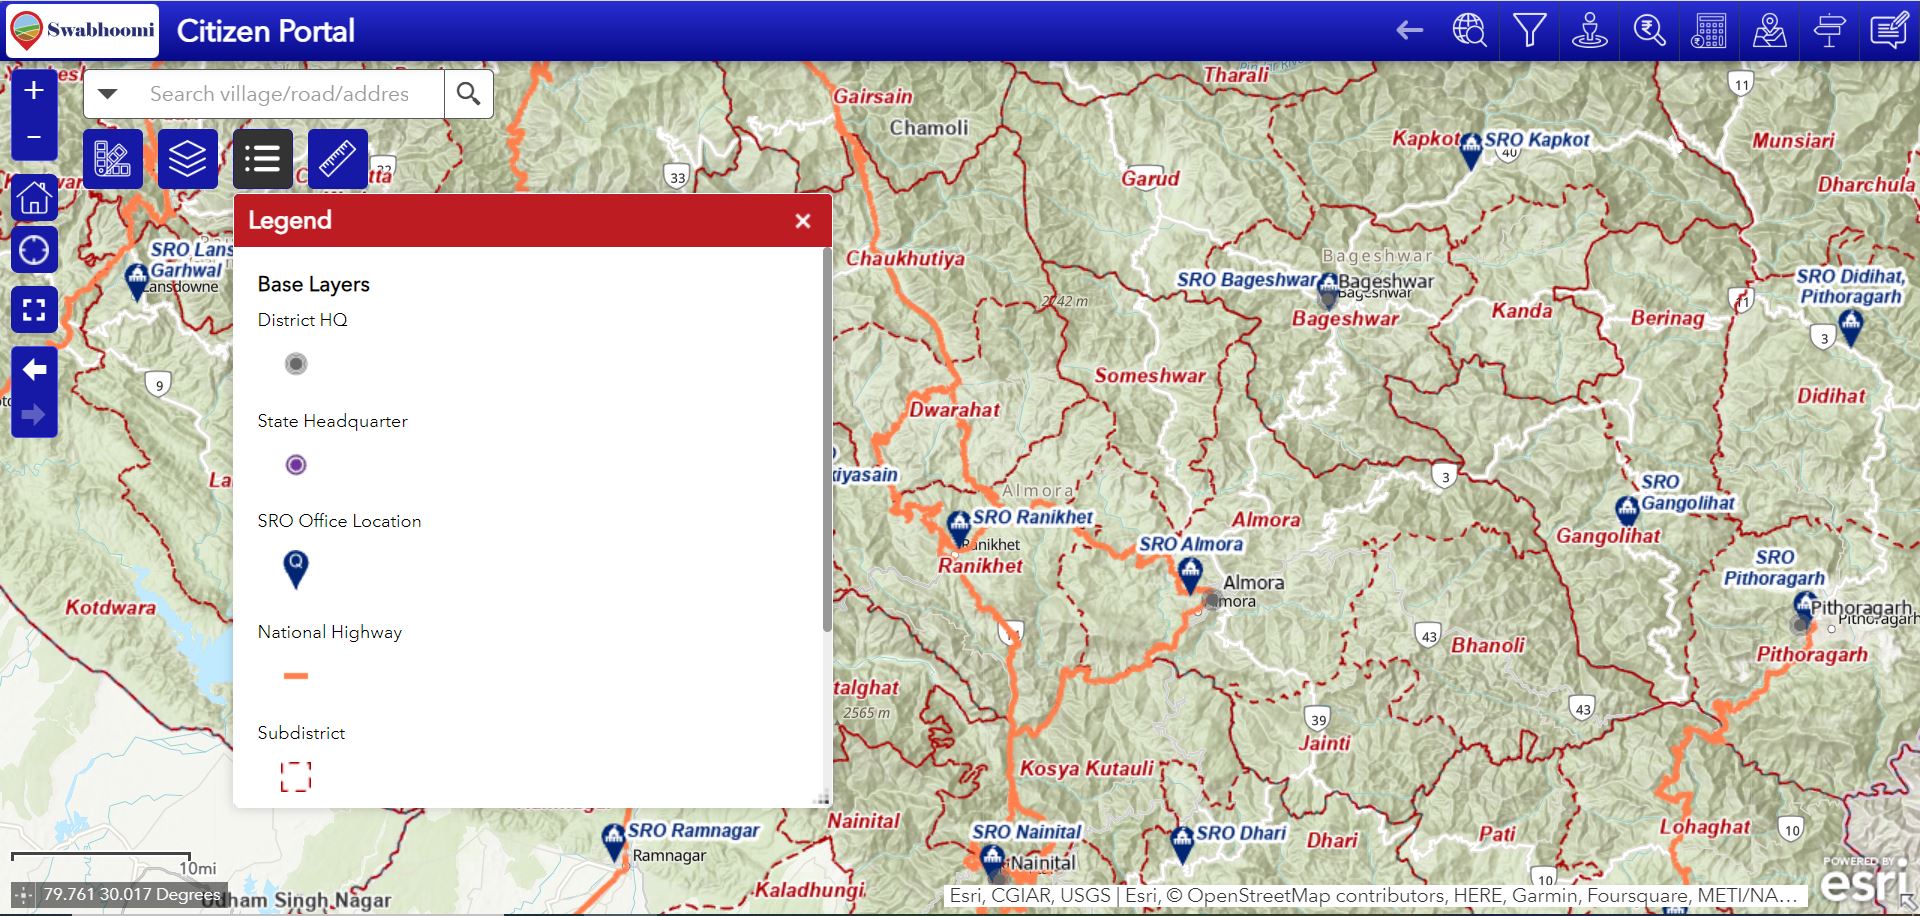
As a map reader, it is important to make sense out of the map and the symbols that appear on it. Legend Tool provides the meaning for the symbols used to represent features on the map.
- Click the Legend icon
 from the
application.
from the
application. - For the styled shapes and symbols given on the map, the legend tool will describe what they depict.
Note: The legend changes dynamically as per the scale of the map.
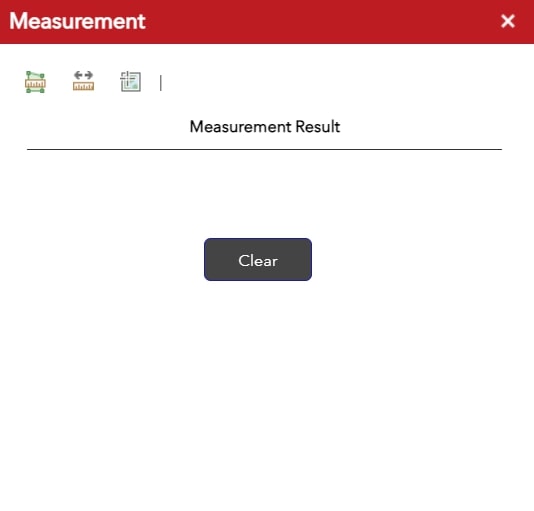
Measurement
The Measurement tool can be used to mark point, draw line or series of connected lines (i.e., polygon) to measure the approximate coordinates of a location, distance, or area respectively.
- Click Measurement icon
 from
the application.
from
the application. - Choose Measure Type (Point/ Line/ Polygon) and Measurement Unit.
- Click on the map at the starting point. Move the cursor to the end point/ next point. Repeat until end point. Double click to finish.
- In case of location, click on a point to view the coordinates of the location. when done, the measurement result is available on the panel.
Query
The Query tool allows user to search specific feature or record from the selected layer by defining the query criteria from the dropdown in query form. Each query works with a single layer. User can define multiple queries for a single layer. The steps involved are
- Click on the Query icon

- Query window has two tabs: Tasks and Results.
- Task: Task tab has list of map service that can be queried. Select any of the layer from list and specify the attribute of feature to be queried in the Query criteria.
- Click Apply.
- Results: The results are displayed in results tab and map gets zoomed to the queried results.
- Click on any result to highlight it on the map area and view its pop up.
- Click on Feature actions option available adjacent to the query result dropdown, and then point and click on ‘Remove this result’ option to close all the query results from the map.
- Similarly, explore other feature actions such as Zoom to, Pan to, Flash, and Show Pop-up to explore query results.


Filter
Filter tool is used to filter the specific roads within the districts and sub districts. The required road layer alone can be filtered. The steps involved are
- Click on the filter icon

- Turn on the layer in which the filter to be done.
- Select a district from the dropdown, list of all the sub districts of the selected district is listed in the next drop down.
- After the sub district is selected, select the roads in that sub district.
- Map zooms and displays only the selected road feature and other road features will be turned off.
- Use reset the filter option to turn off the filter. If the filter is turned off map returns to its default extent and all the features in layers are turned on.
- Filtering using single attribute can also be done.

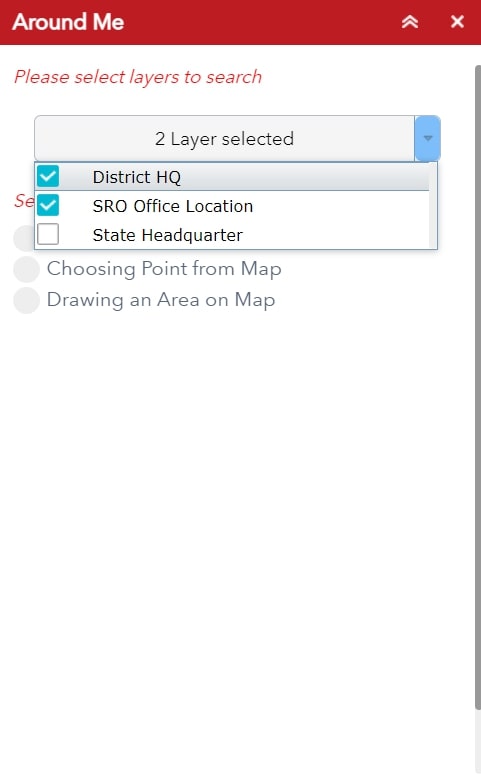
Around Me
Around me tool allows the user to quickly identify services/facilities around a specified location point. It shows a complete list of all the nearest service providers in all the selected layers (e.g. SRO locations, Landmarks and Civic Amenities, etc.) along with the aerial distance. The steps involved are
- Click on the Around me icon

- Multi-select the layers from the dropdown.
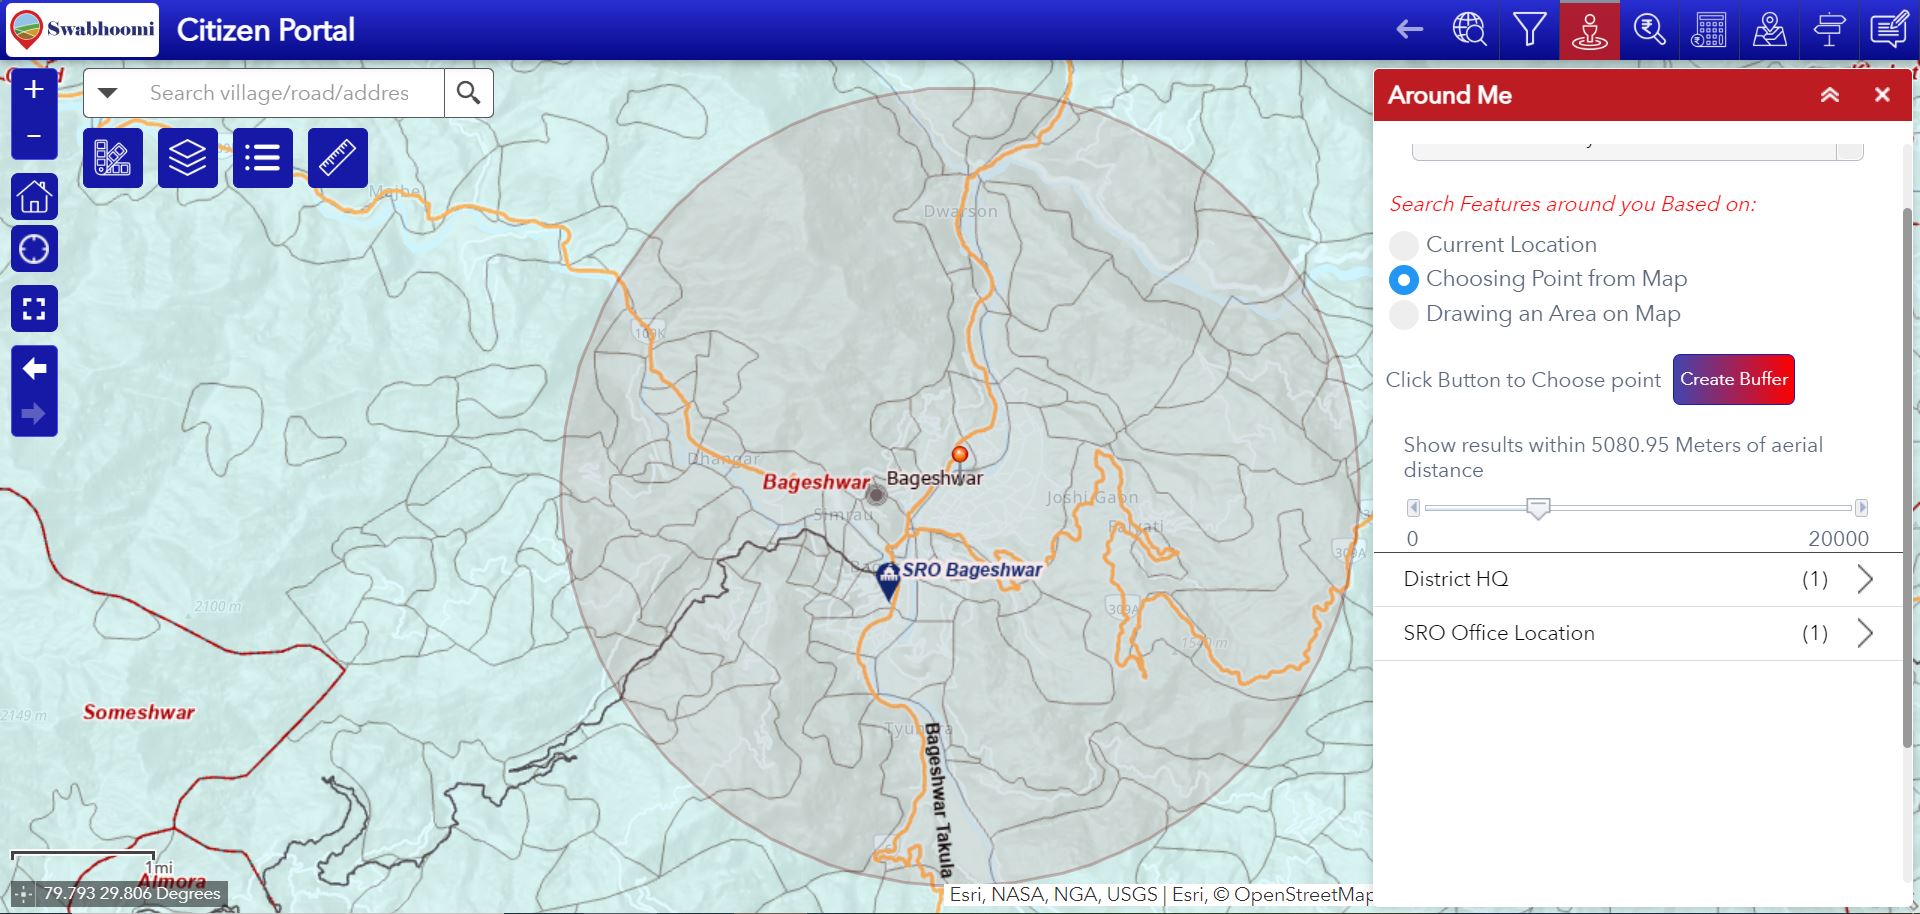
- Select for Search Features around you based on Current Location, Choosing point on Map or Drawing an Area on Map.
- For Current Location option
- 'Get Current Location' button will be available. Click that to locate you. Buffer will be created around you based on distance specified distance in the slider.
- Drag the slider to set buffer distance (you can select up to 5 KMs of aerial distance).
-
For Choosing point on Map option
- 'Create Buffer' button will be available.
- Click on the button and click on a location on your map to create buffer around it.
- Drag the slider to set buffer distance (you can select up to 5 KMs of aerial distance).
-
For Drawing an Area on Map option
- 'Draw on Map' button will be available.
- Click on the button and start drawing on the map to search features.
- Total number of location points within the buffer/drawn polygon gets displayed adjacent to the layer name in the result panel based upon the search.
- On clicking layer name, list of all the location points gets visible along with the distance from selected point.
- On further clicking one of the location points from the list, all the information related to the location point gets visible on the window and the location point gets highlighted on the map.
Note: The distance calculated is the aerial distance.

Search Circle Rate by POI
The Search Circle Rate by POI tool ![]() is used to get the applicable circle rate at any the point of interest, selected on the
map.
is used to get the applicable circle rate at any the point of interest, selected on the
map.
- Click on the ‘Select on Map’ button and click anywhere on the map where the user wants to get the applicable circle rate information in Uttarakhand state.
- Map should get zoomed to the selected point and available circle rate feature information are displayed in the tables and highlighted on the map.
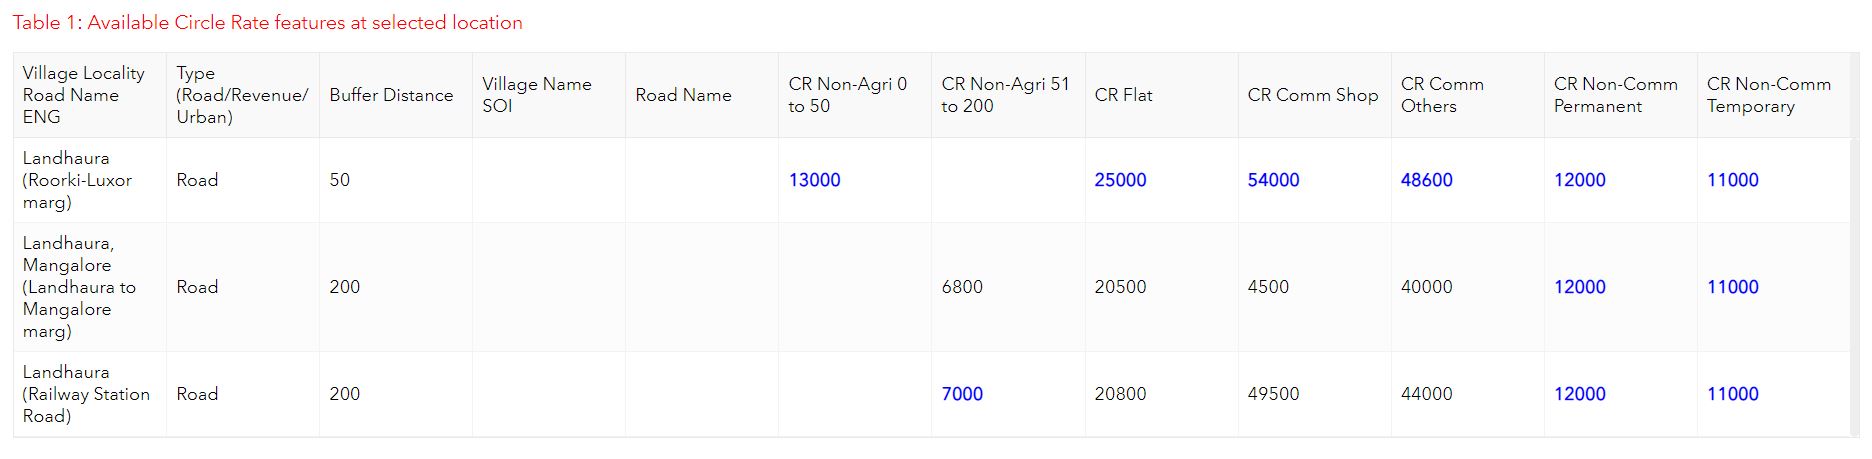
- Then applicable circle rate details for each the property types will be summarized in the tables namely
- Revenue circle rate and circle rate of all the roads that intersects the point of interest is listed in this summary table. Highest circle rate of each sub types among all the listed road and revenue features is highlighted as blue color.
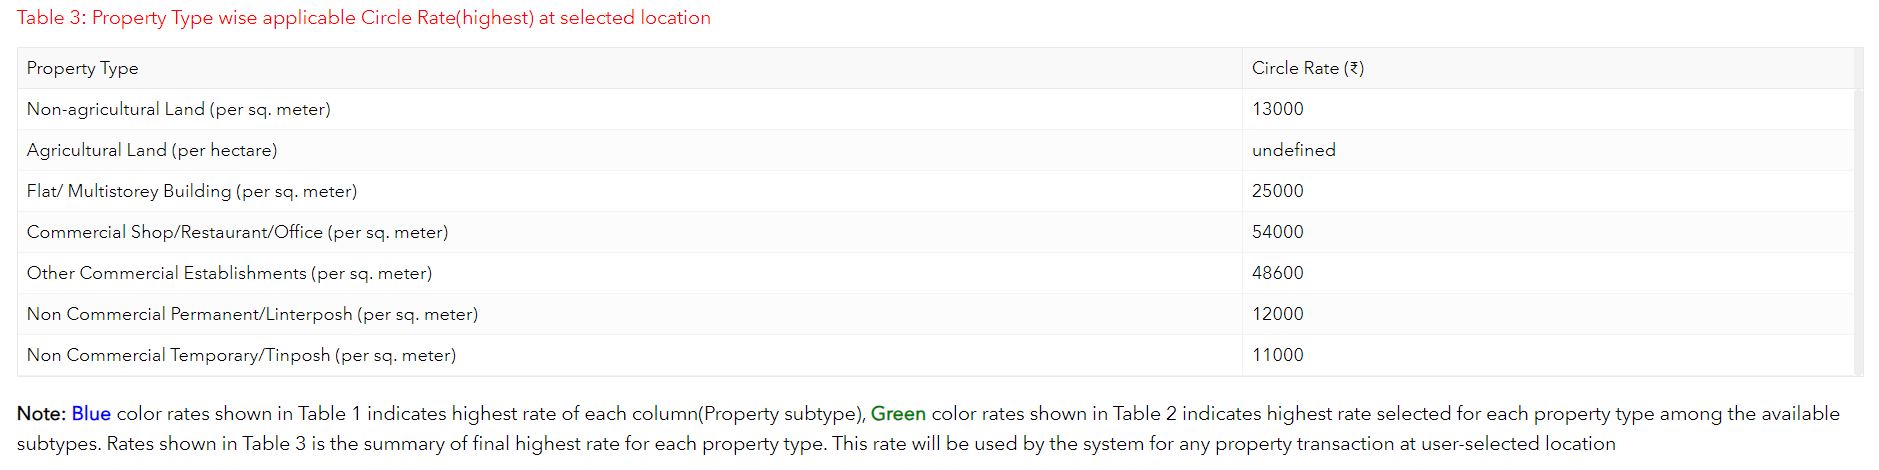
- Highest circle rate among the sub types of each property type is highlighted in this table as green color.
- Final applicable circle rate for each the property types in the selected location is given in this summary table.
- Click ‘Clear’ button to remove all the highlighted features and summary table from the display.

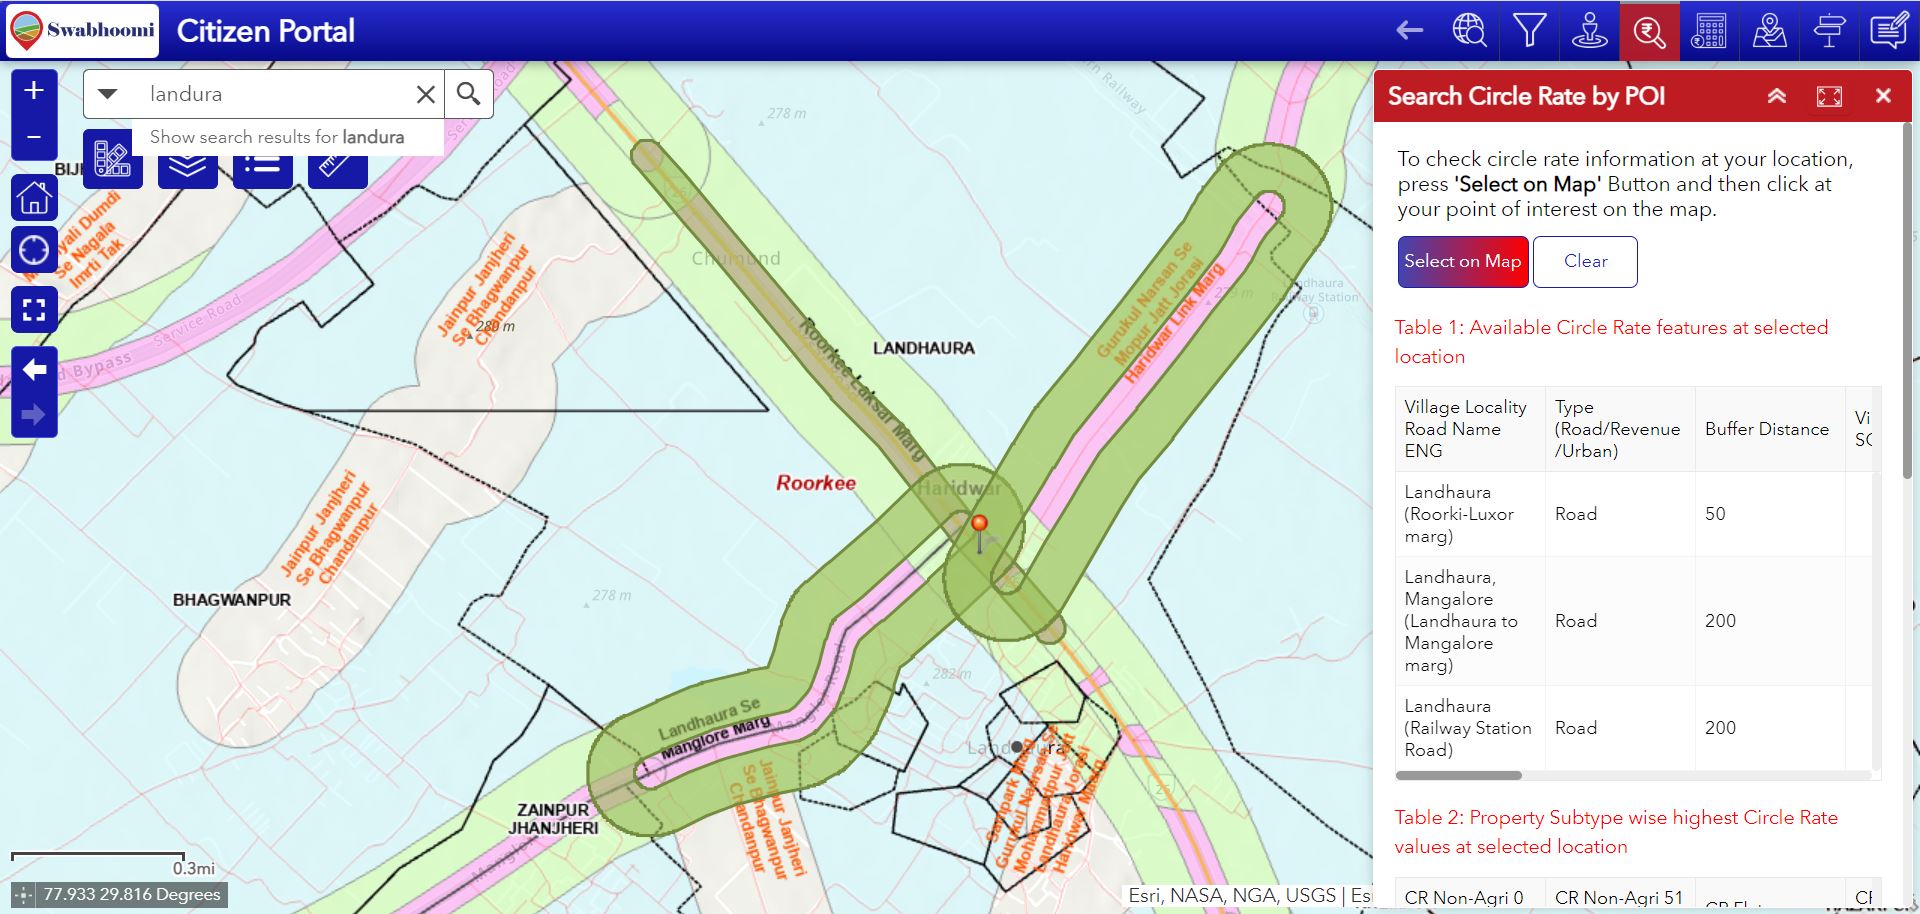
Available Circle Rate features at selected location :
Property Subtype wise highest Circle Rate values at selected location :

Type wise applicable Circle Rate(highest) at selected location :
Stamp Duty Calculator
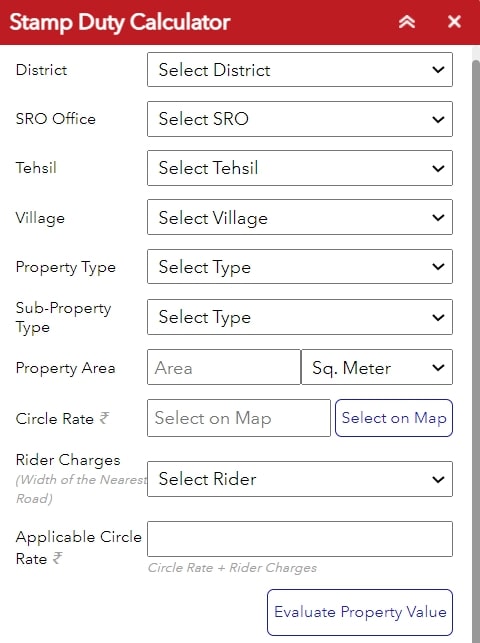
The Stamp Duty Calculator functionality is used to determine the stamp duty and registration fees applicable while buying a piece of plot in the state of Uttarakhand. The steps involved are
- Click on the stamp duty calculator icon
 and the Stamp Duty Calculator window is opened.
 - List of dropdowns are available. User can make use of the dropdowns to select the values for District, SRO Office, Village - on selection, map gets zoomed to village.
- Then select the Property Type and Sub-Property Type along with the units and property area.
- After clicking "Select on Map" button, basemap changes to satellite imagery for better identification of plot by user. Then select the plot location in the selected village and Circle rate gets computed automatically. Basemap changes to original basemap.
- Select the rider, which is the width of the nearest road to the plot, from the Rider Charges dropdown. The width of the nearest road can be; less than 5 meter, between 5 and 12 meter, between 12 and 15 meter, and greater than 15 meter, for which the respective rider charges will be 0, 5%, 10%, and 15% extra on the existing circle rate. On selection of rider, Applicable circle rate value gets computed automatically.
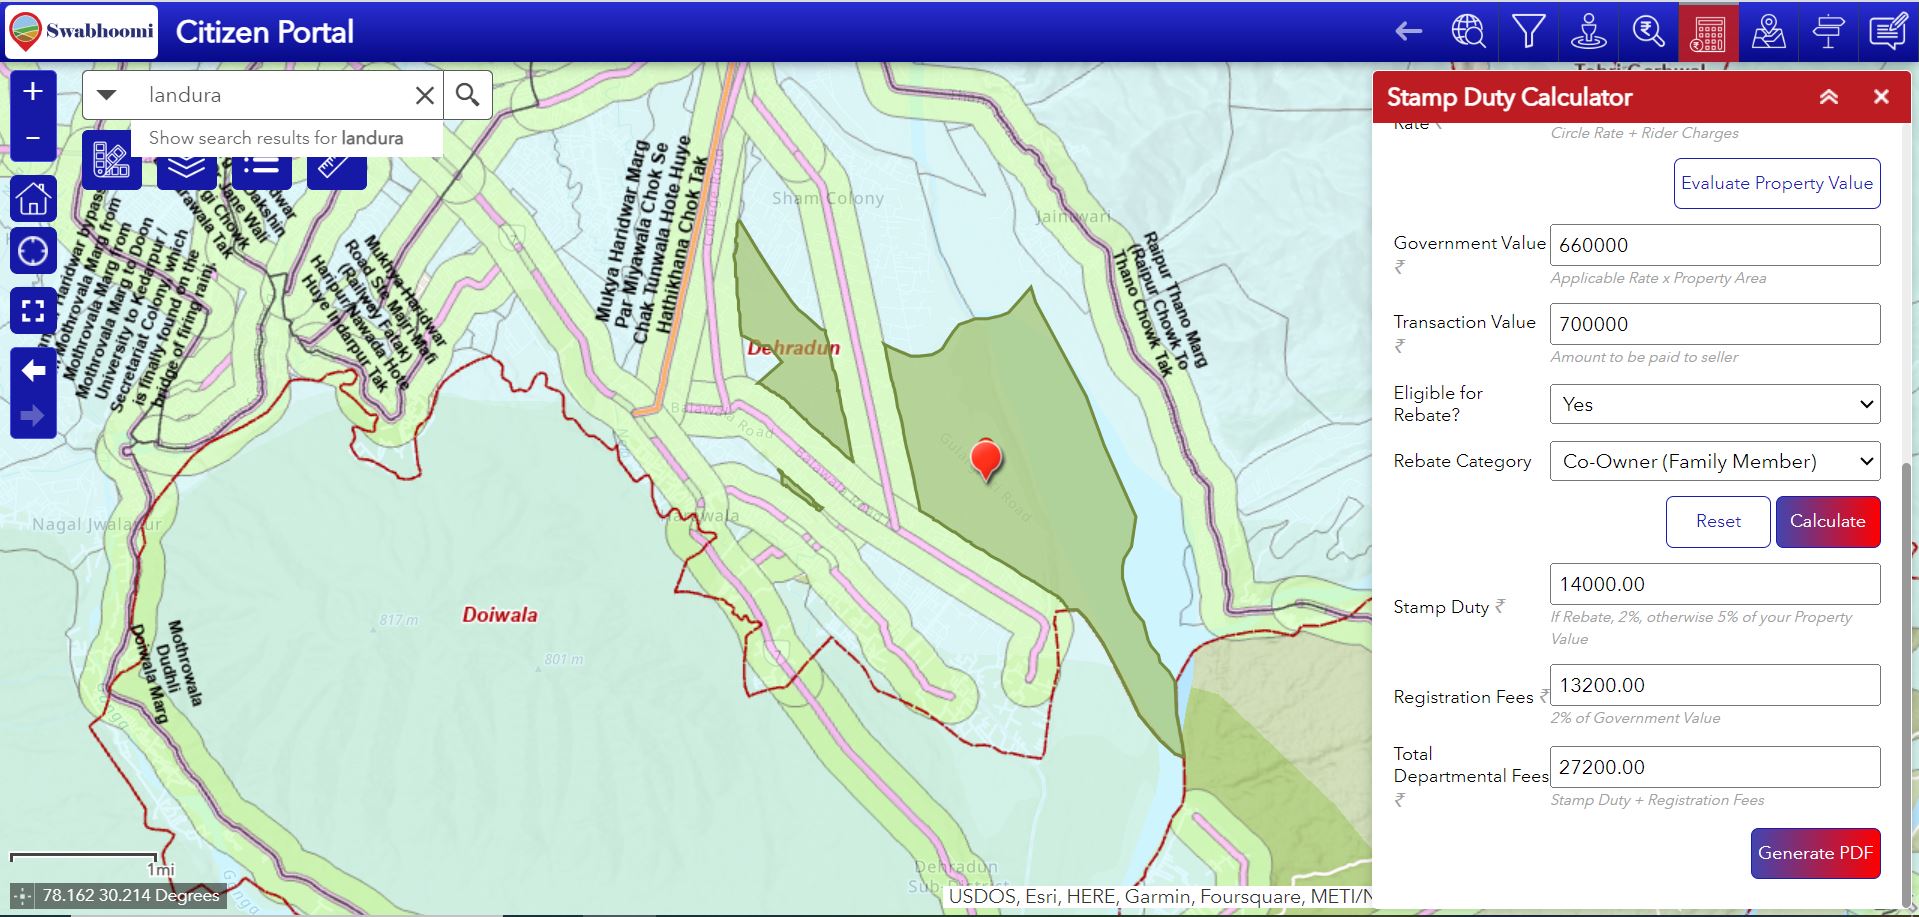
- Click on “Evaluate Property Value” button, Government value box gets computed.
- Provide Transaction value i.e., the actual amount the user intends to buy the piece of land for and is always either greater than or equal to the government value.
- Select Yes or No option from Eligible for Rebate dropdown.
- Select 'Rebate Category' from one of the mentioned dropdown values if applicable. If the applicant is handicapped, female buyer, army buyer, or co-owner (family member), they can apply for rebate.
- Now after filling all the details click ‘Calculate’. The stamp duty, registration fee, and the total fee gets populated in the respective columns.
- Use ‘Generate Pdf’ to option to download all the details provided and computed in pdf format titled as "Stamp Duty Self-Assessment Receipt".
- Use ‘Reset’ option to clear all the fields in the dropdown and all the values entered in the text boxes.

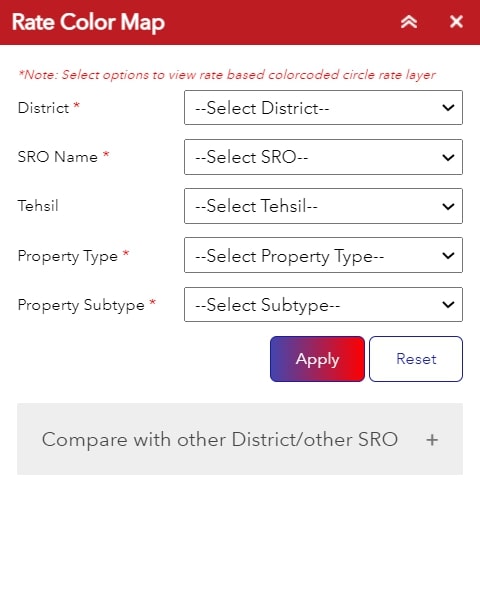
Rate Color Map
The Rate Color Map tool ![]() is used
to generate the color-coded circle rate features based on circle rate
ranges for the selected District, SRO, Property type
and subtype.
is used
to generate the color-coded circle rate features based on circle rate
ranges for the selected District, SRO, Property type
and subtype.
- Select the details of the location from District, SRO and Teshil dropdowns.
- Select Property type and subtype for which to generate the color map.
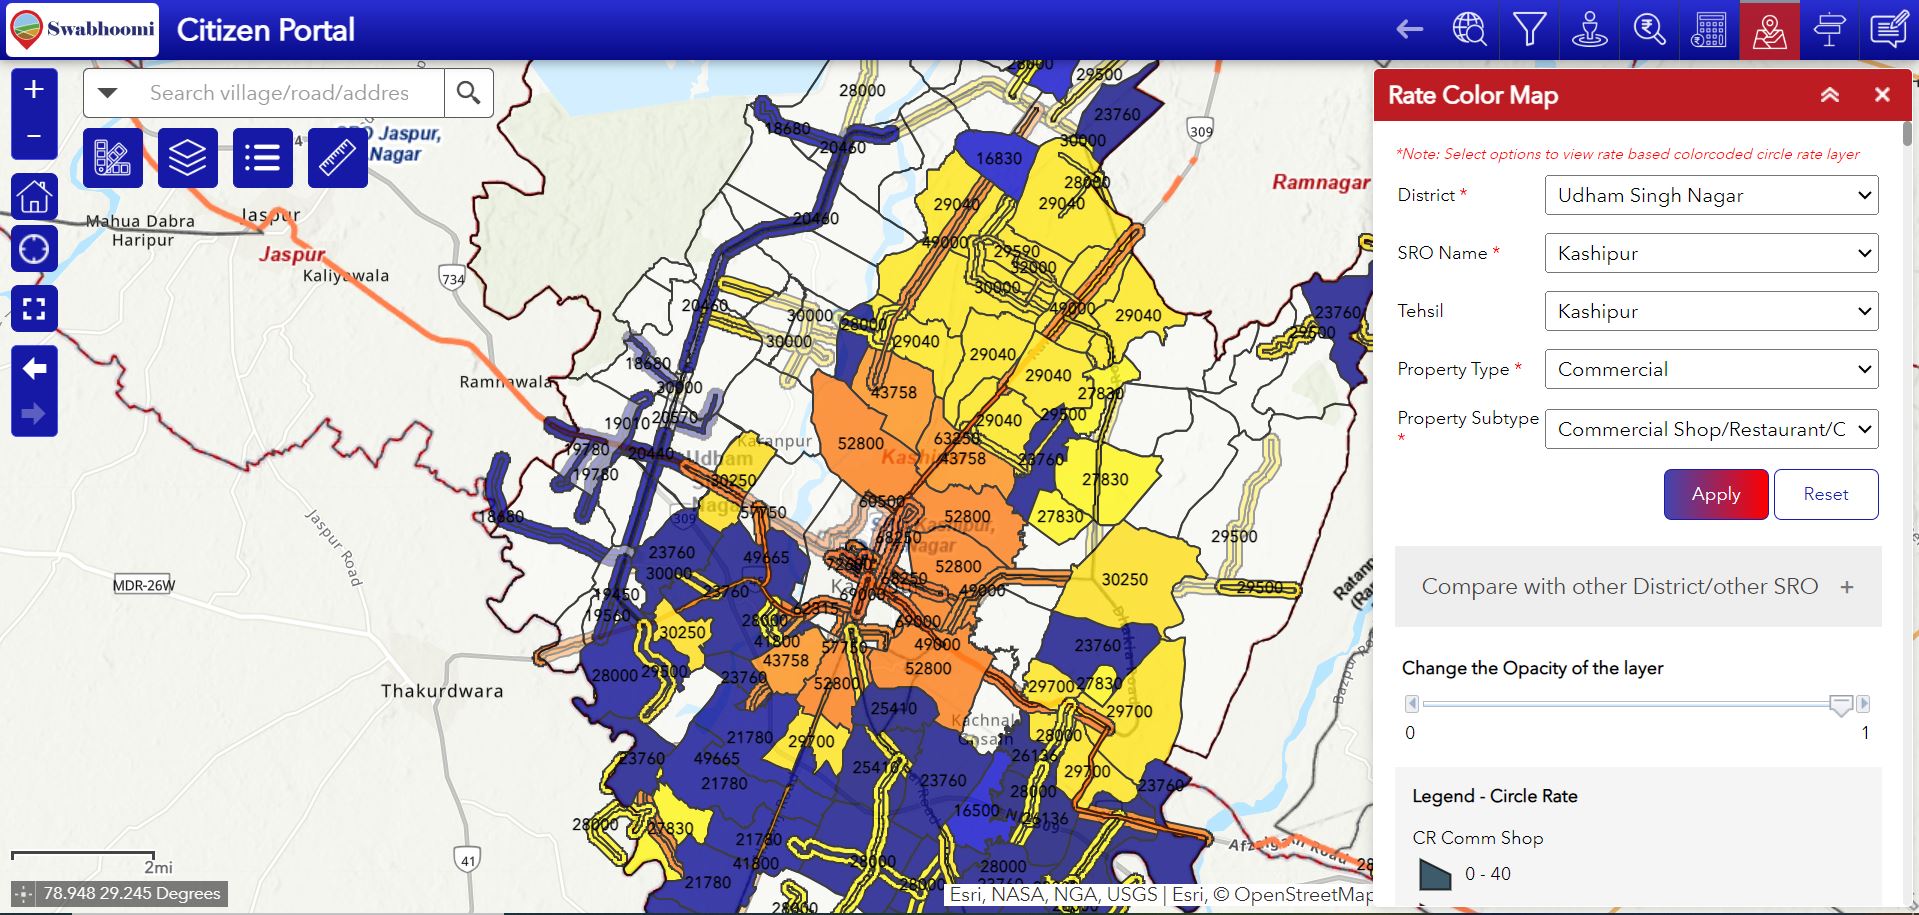
- Click ‘Apply’ button. Based on the details provided in the dropdowns, map gets zoomed to selected SRO extent with the color-coded circle rate polygons under selected district and SRO with labels of selected property type and subtype rate (color pattern varies as per circle rate ranges - lowest rate as lighter color and Highest rate as darker color).
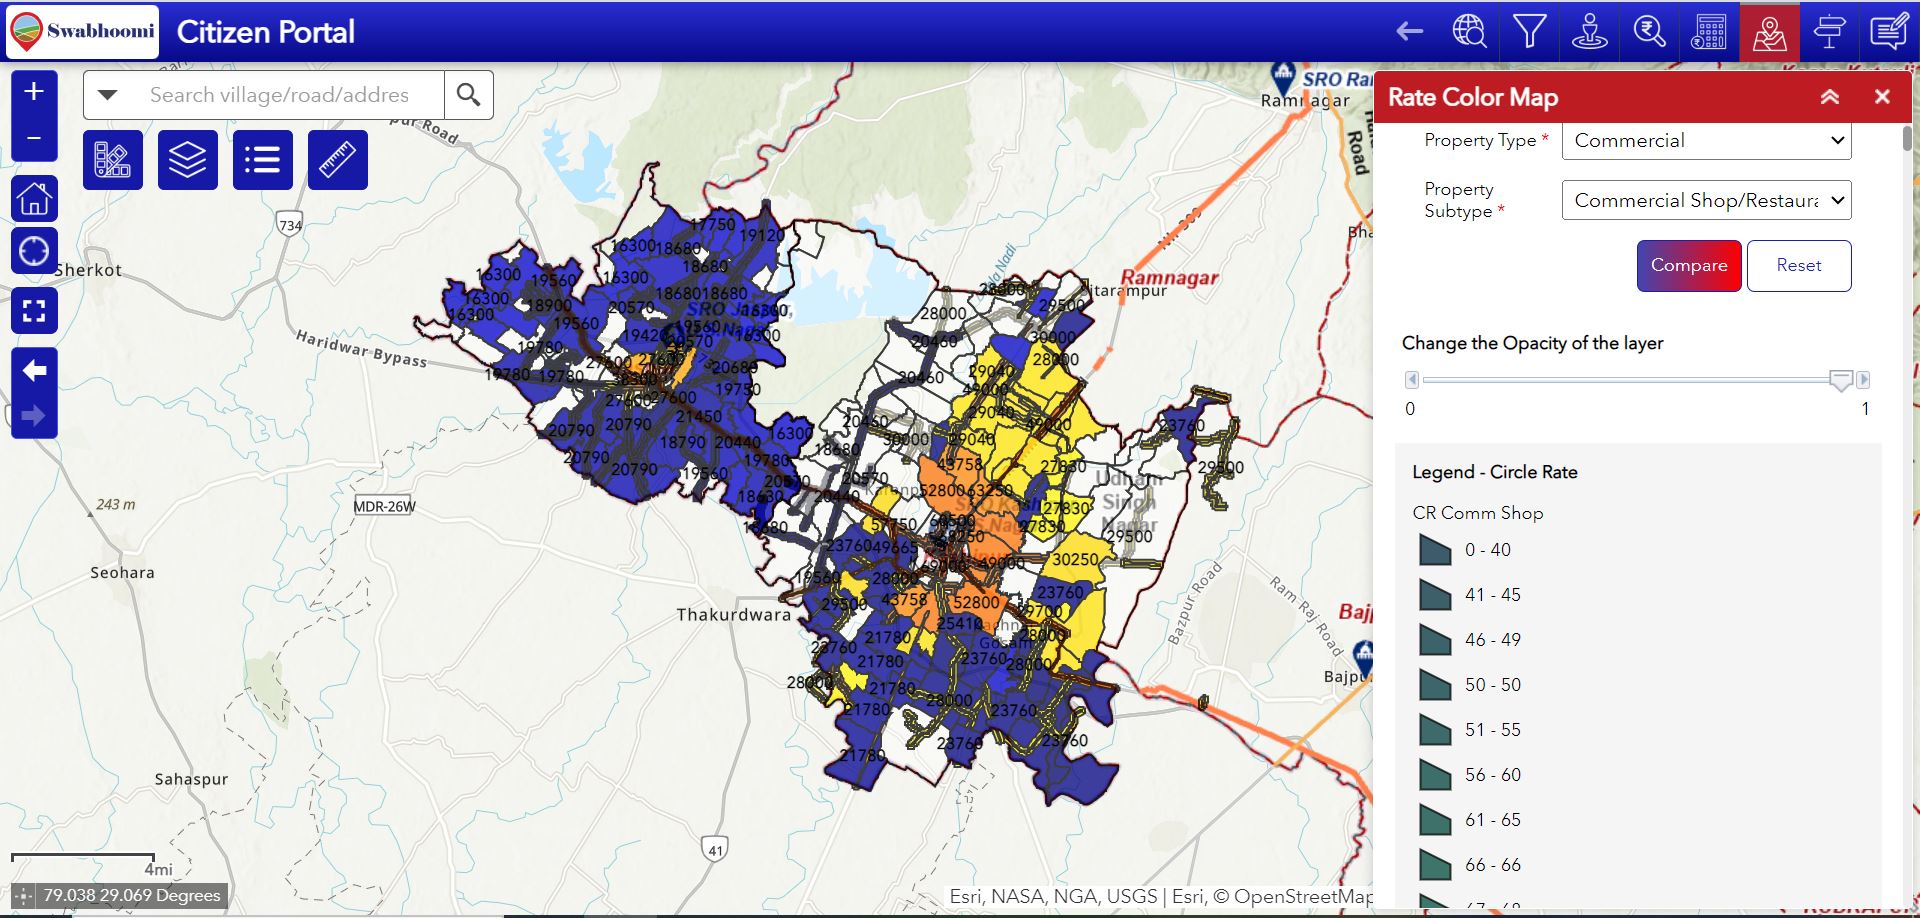
- Change the transparency level of the color-coded circle rate layer using the opacity slider below. Opacity value 1 is not transparent at all, 0.5 is 50% see-through, and 0 is completely transparent.
- Legend of the circle rate polygons will be updated below to the opacity slider
- Click ‘Reset’ button to clear all the details entered and remove the color-coded circle rate polygons from the map
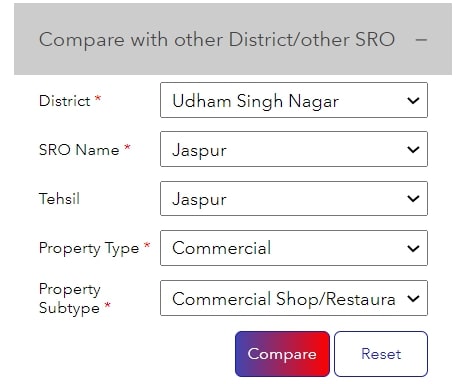
- Select the adjacent district/SRO to compare with previously selected District & SRO
- Enter the details of another District/SRO in the dropdown
- Click ‘compare’ button, then map zooms to the selected SRO extent and color-coded polygons under selected district and SRO with labels of selected property type and subtype rate are created on the map
- Click ‘Reset’ button to clear all the details entered and remove the compared region’s color-coded circle rate polygons from the map
Compare with Other District/Other SRO
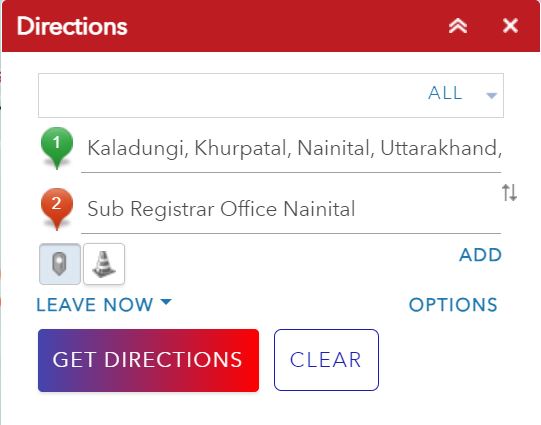
Direction
The direction tool provides the route information from start location to end location. Multiple destinations can be added to the route.
- Hover the mouse, system displays the Directions tool tip
- Click on Directions tool icon
 to open Directions window:
 - Move the mouse over the Textbox my Current Location icon appears at the left corner of the textbox as shown below:
- Click on Use my Current Location icon to input your current location as point A on map or else enter first few words of your location in textbox.
- Repeat the above step to input your destination.
- As you enter the text list of suggestions appears based on the text entered. Two categories are
available in direction
- SRO office location - Enables routing between SRO offices in Uttarakhand
- ArcGIS geocoding Service – Enables routing for all the locations for which the network data is available.
- Click on ADD DESTINATION button to add the Stops as shown below
- On adding all the points, directions and routes gets displayed between the starting and ending point with the total kilometers to be travelled between source and destinations
- On clicking the Options button, return to start and unit conversions between miles and kilometers controls appears on Find Direction window.
- Select the Return to Start checkbox and click on Get Directions button to calculate the distance and time taken to traverse back at the starting point using the same route. System displays the distance and time on the window.
- Click on Clear button to clear the results and graphics on map
- User can also print the route map using print option.


Feedback
Citizens can use this tool ![]() to
provide feedback about the performance of the portal or to provide any
suggestions. The steps involved are given below,
to
provide feedback about the performance of the portal or to provide any
suggestions. The steps involved are given below,
- The window displays three radio buttons. Select one of the options to provide the feedback.
- Compliment
- Suggestion
- Complaint
- Select the details for Category, District, SRO, Tehsil and Village in the respective dropdowns and map gets zoomed to the selected village and the basemap is changed to Satellite Imagery.
- Then zoom-in and select exact location on map to set location co-ordinates related to the feedback if required. Please note that this step is optional.
- Add Description and Address as it is mandatory. On clicking the description textbox, a pop-up displays for the user to type in the contents related to the feedback. Only after clicking the Confirm button on the popup, the content on the popup window will be reflected in the description textbox.
- Attachment relevant to the feedback, can also be added, if any.
- Attach PDF or Image relevant to the feedback, if any by clicking on to the choose file button and can optionally provide details like Name, City and Pin code.
- Enter the mobile number and click send OTP button. Once OTP is received, enter the same in OTP box and click ‘Verify’ button.
- Click ‘Submit’ button to send your feedback to the department.
- Click ‘Reset’ button to clear all the details entered and refresh Feedback window.
